I am really happy with the actuator functionality in Spring Boot applications. It offers some fantastic tools for gaining insight into your application. Some of the REST endpoints that you get - such as health and metrics - are easy to read. Despite the fact that they render as JSON, my guess is that your human eyes still can comprehend it.
But have you ever taken a look at the output from Spring Boot's dump endpoint?
That’s really not so friendly to read. At least not for my kind of eyes. And perhaps thats okay - if you got some tooling that can parse the thread stack info and show it nicely to you. But chances are that you don’t have that - like I didn’t.
So, a while back, I decided to create a Spring Boot plugin that you just include on the application classpath. Like you do with the Spring Boot starters. This is what you get:
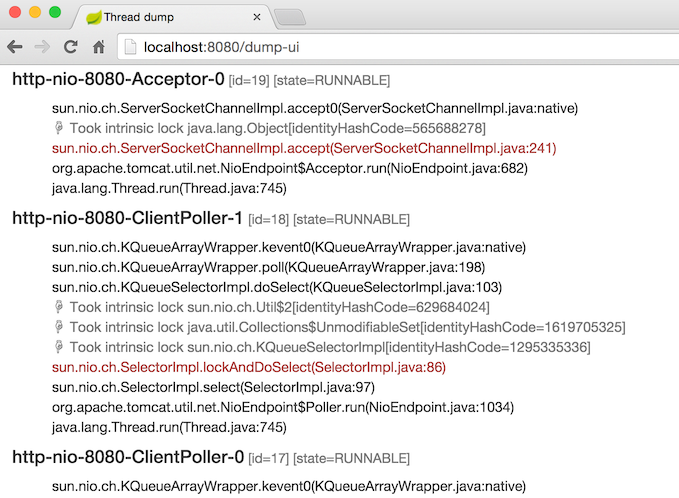
Red lines indicate methods that owns an intrinsic lock (think synchronized in Java land). I added a little gray line above each such event: it tells you what kind of class the intrinsic lock is associated with.
I have added this plugin to the Maven Central. Find it here.
The code is OSS - find it at GitHub. It is also here that you will find some extra documentation on how you can configure the plugin - so check it out if you want to give it a spin.
By the way: It was very interesting to make such a Spring Boot plugin. It uses auto configuration and other cool stuff. If you think that sounds interesting, then look at the code: it is really simple 😉.